Introduction by Art.S 04/10/2021 Post COVID-19
How do we setup and analyze our testing circuit connections pin-by-pin on a chip?
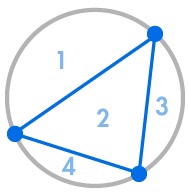
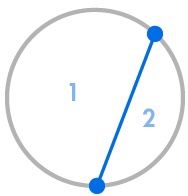
Imagine that we place several points on the circumference of a circle and we need to connect every point with each other.
This divides the circle into many different regions, and we can count the number of regions in each case.
The diagrams below show how many regions there are for several different numbers of points on the circumference.
We have to make sure that only two lines meet at every intersection inside the circle, not three or more. Art.S
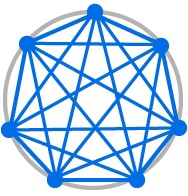
CASE=6 Totally Confusing Chart – right?
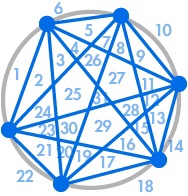
CASE=5 Confusing and Hard to Read Chart – right?
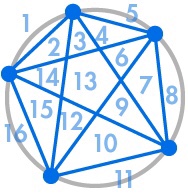
CASE=4 Confusing However Readable Chart – right?
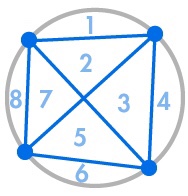
CASE=3 A bit less confusing chart – right?
CASE=2 Much less confusing chart – right?
CASE=1 A Simple chart – right?

CASE=0 Not it all confusing chart – right?

Great work!